clolours
The colours function creates a n x 3 colour-matrix with n colours. These colours have roughly the same colour distance to each other, which makes it easier to distinguish between them. The function aims to provide distinguishable colours for figures, it is not intended to achieve colorimetric accurate results.
Usage:
c = colours(n,'parameter',value)
Where:
| Parameter | Description |
c | Is the n x 3 returned colour matrix |
n | Specifies the number of colours |
'parameter' | Optional paremeters: ‘L’: Specifies the brightness as a 1 x n vector in the range from 0 to 100 (default: equidistant from 20 to 90) ‘S’: Specifies the satturation as a 1 x n vector in the range from 0 to 100 (default: constant 200/3) |
Note: there is also a colors pendant with the same functionality for those who prefer american spelling.
Examples
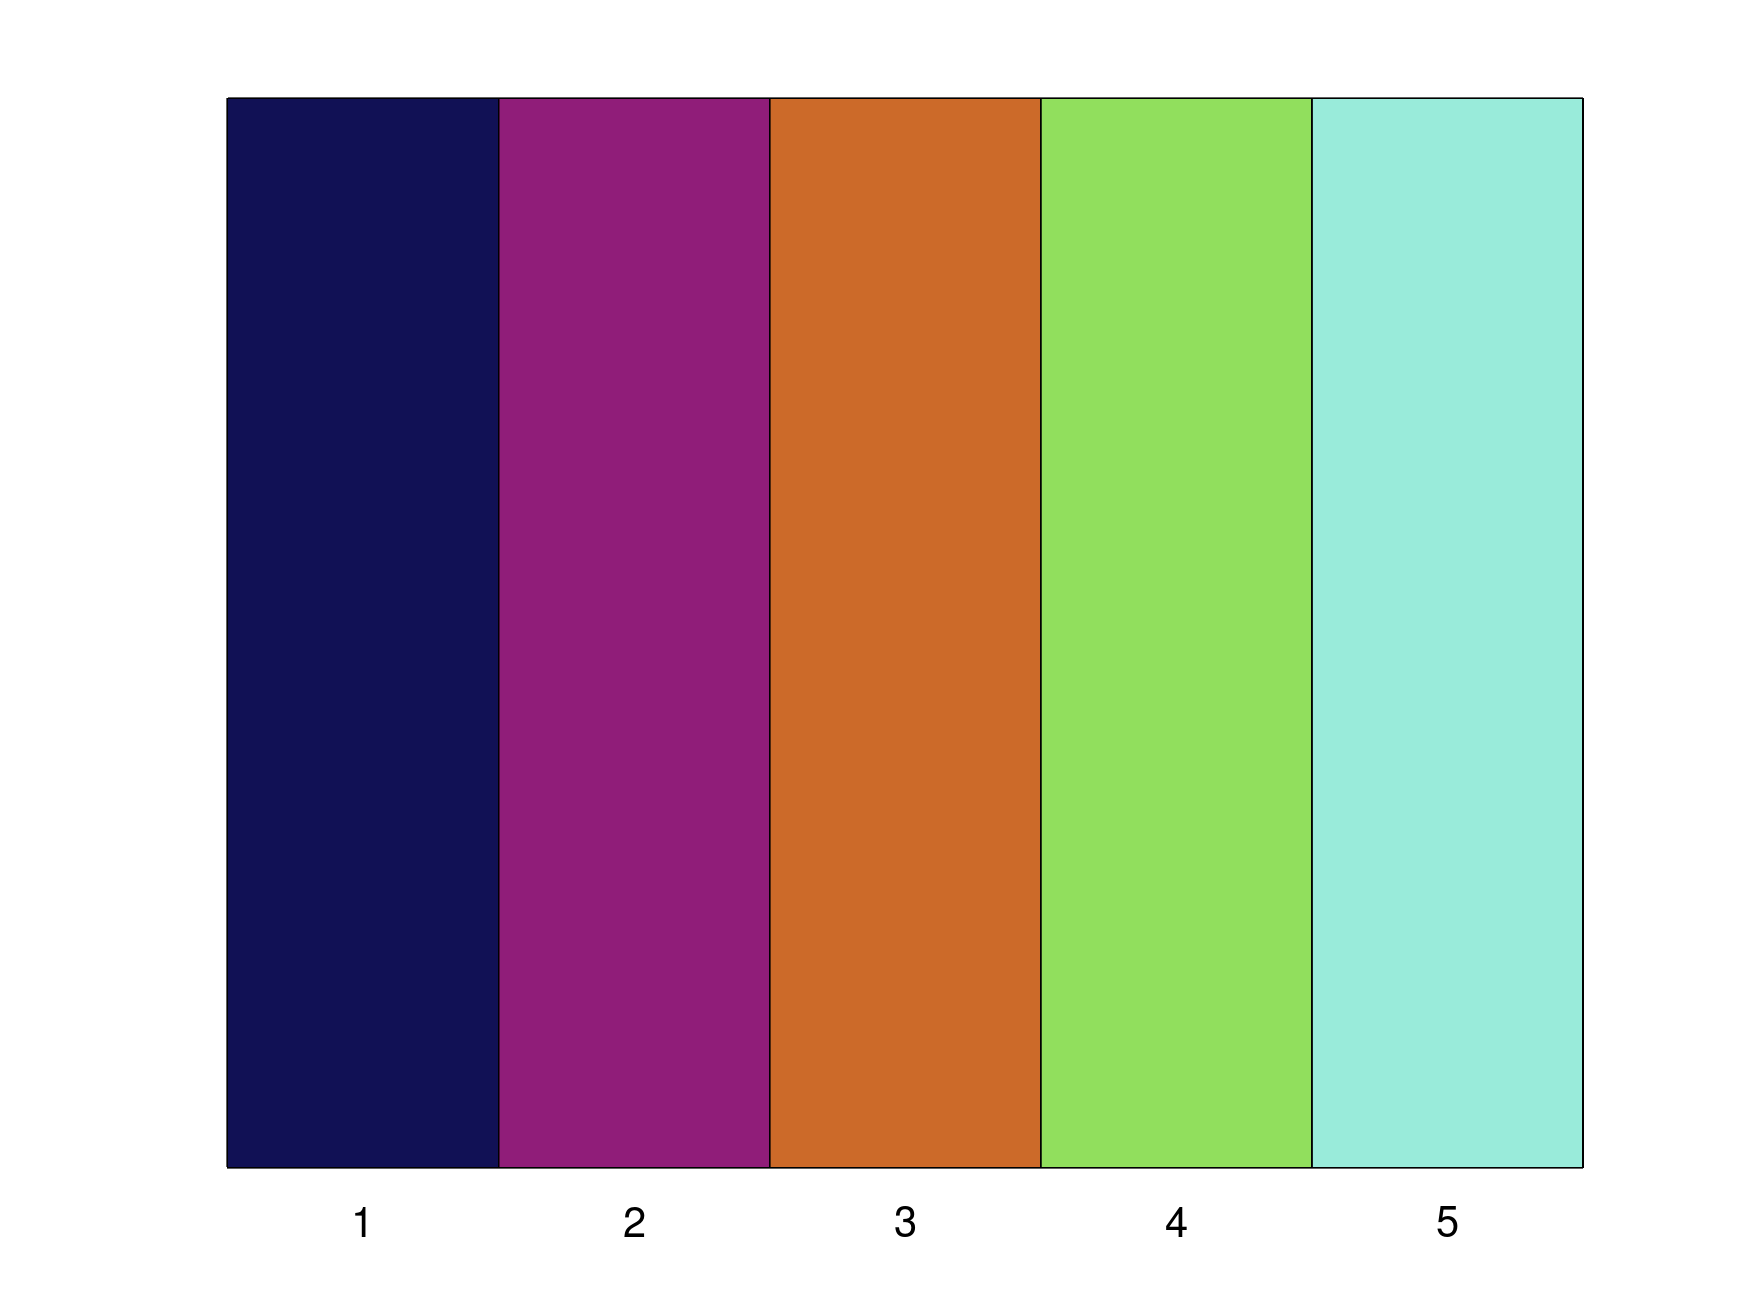
Create 5 distinguishable colours:
c = colours(5)
colourplot(c)
See also: plotcolour
Result:
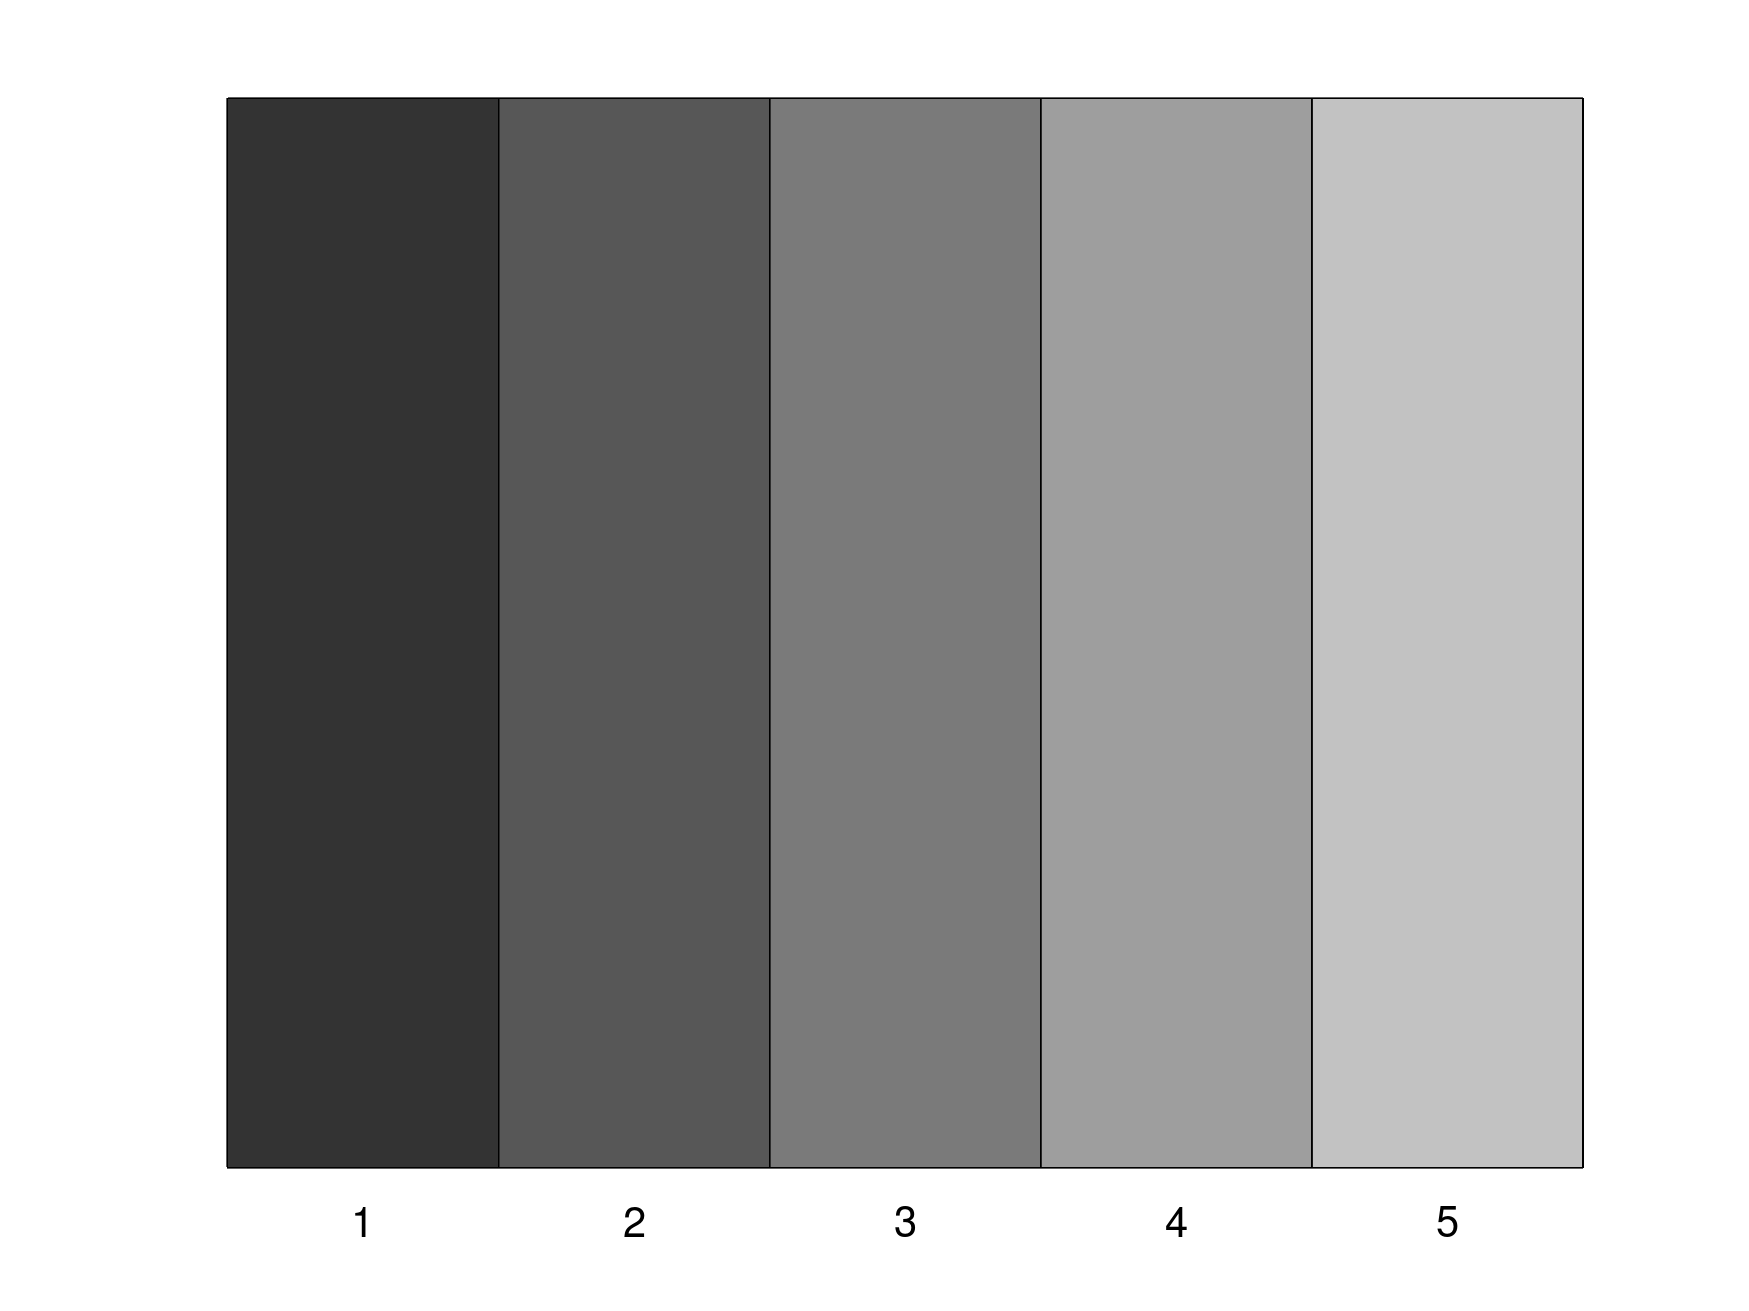
Create 5 distinguishable grayscales:
c = colors(5,'S',zeros(5,1))
colourplot(c)
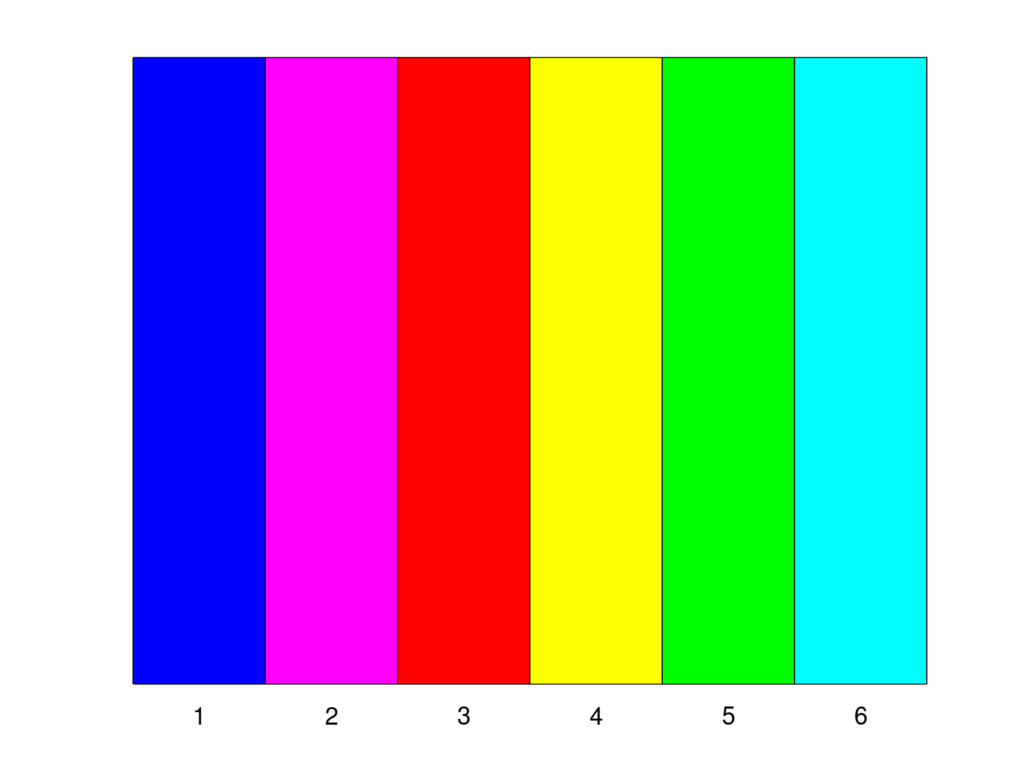
Create 6 colours with the same brightness and saturation:
n = 6;
L = 50;
S = 100;
c = colors(n,'L',ones(n,1).*L,'S',ones(n,1).*S);
colourplot(c)
See also: plotcolour
Result:
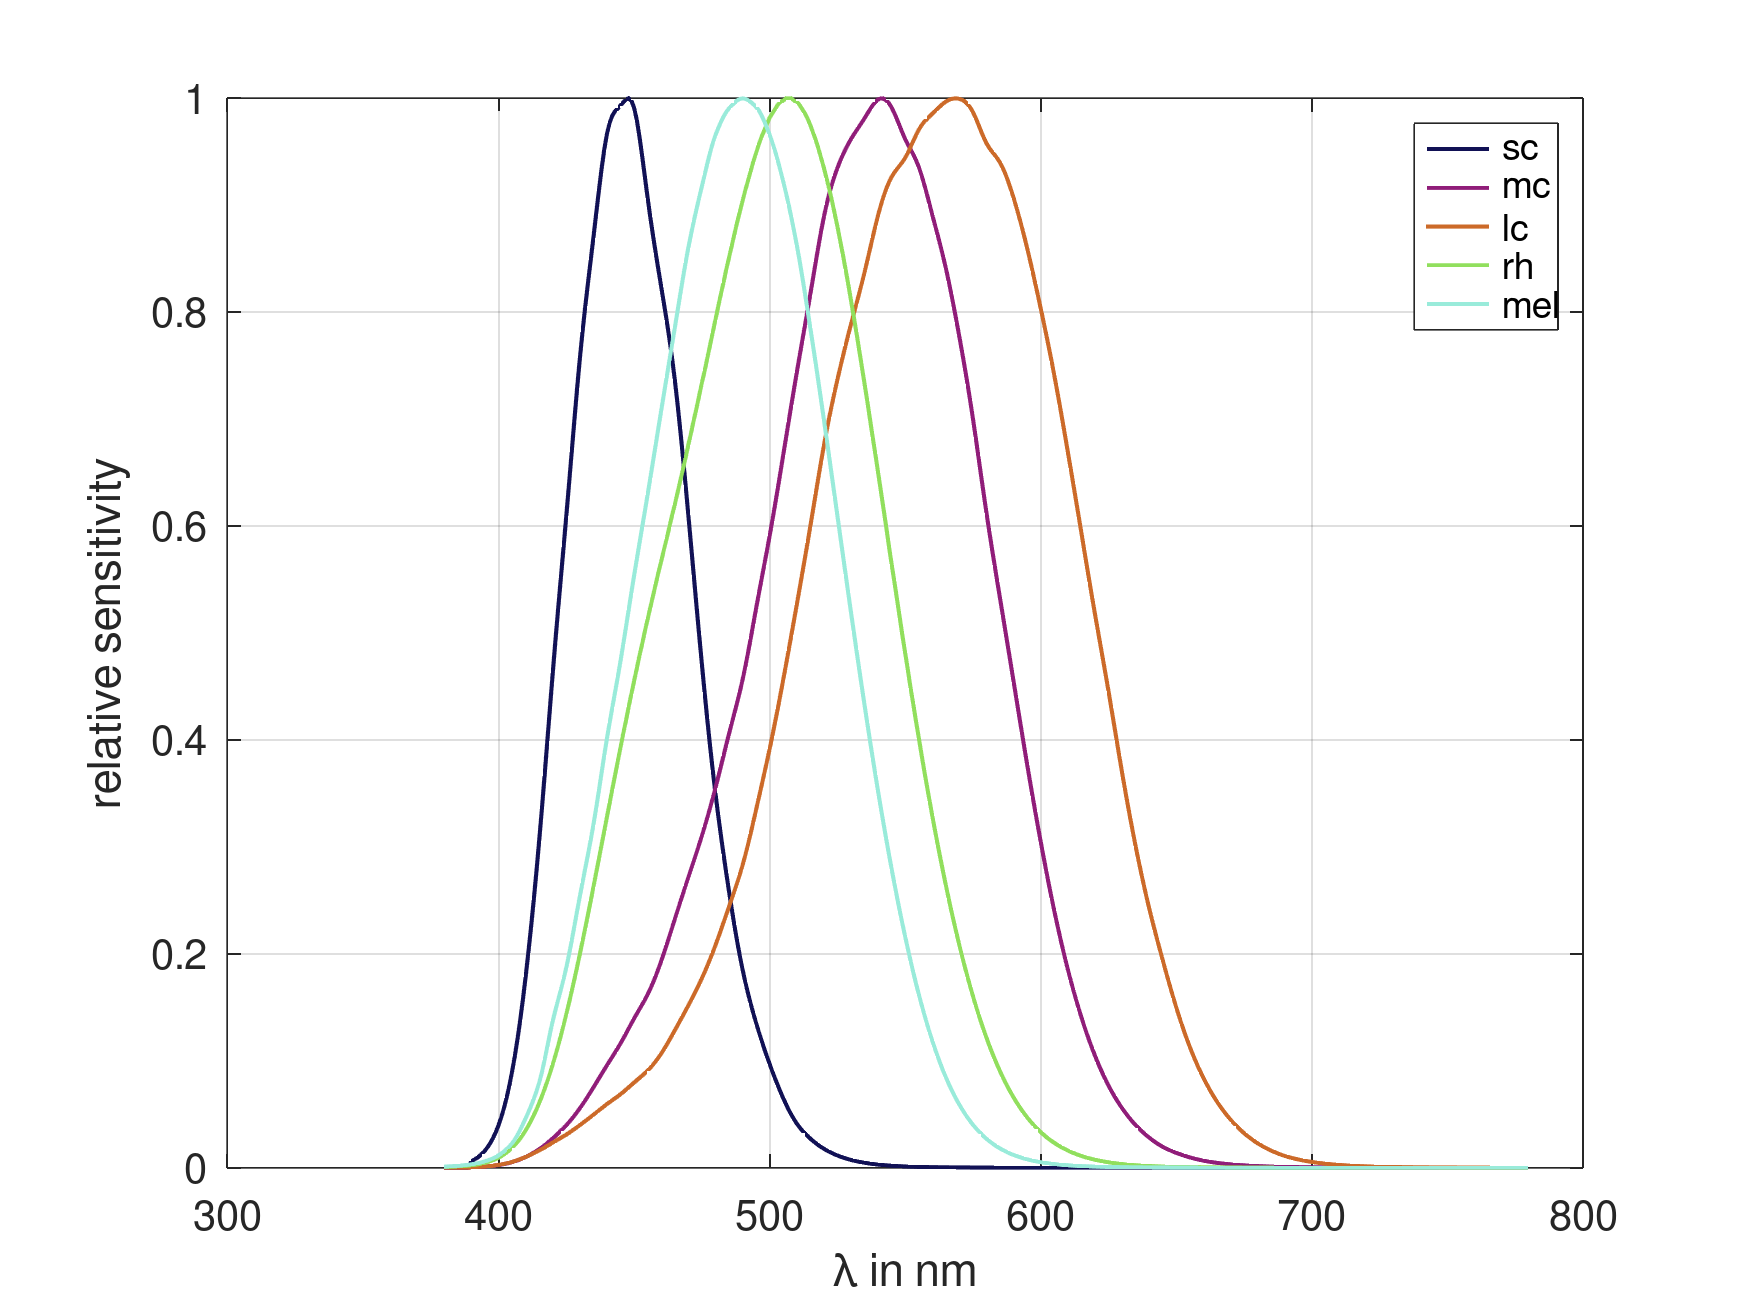
Create 5 colours and use them in an α-opic sensitivity figure:
% create 5 spectra
lam = 380:780;
spec = ciespec(lam,'a-opic');

% create 5 colours
c = colours(5);

% plot a-opic spectra
plotorder(lam,spec,c);
grid on
legend({'sc','mc','lc','rh','mel'})
xlabel('\lambda in nm')
ylabel('relative sensitivity')
Result: