
The plot3dldc function plots a 3D illustration of a given light intensity distribution curve (LDC).
See also: readldt
Usage:
plot3dldc(ldt,'parameter','value')
Where:
| Parameter | Description or value |
ldc | Is a valid light intensity distribution curve struct, see readldt function |
'clr' | 1\times 3 colour vector, default orange: [0.8594 0.5153 0] |
'mode' | ‘3D’ – 3D plot (default) ‘wire’ – 3D wireframe plot, blue line marks C0 plane ‘norm’ – normalized 3D wireframe , blue line marks C0 plane |
'origin' | 1\times 3 vector, defines the origin in cartesian coordinates of the LDC. Default [0 0 0] |
'rotation' | 3\times 3 rotation matrix for rotated LDC plot |
Examples
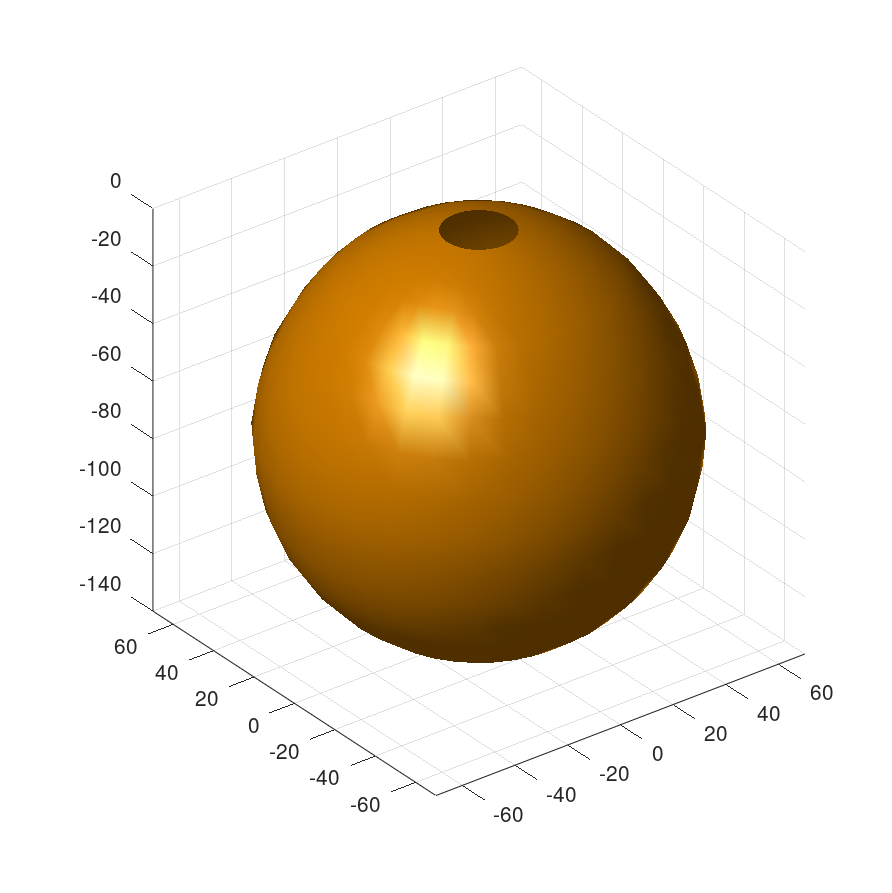
Plot lambertian LDC:
ldc = readldt('lambert.ldt');
plot3dldc(ldc)
See also: readldt
Result:
Note: To select a file via a popup dialog window, use the following code snippet:
[file,path] = uigetfile('*.ldt');
% select EULUMDAT file %
ldt = read_ldt([path file])
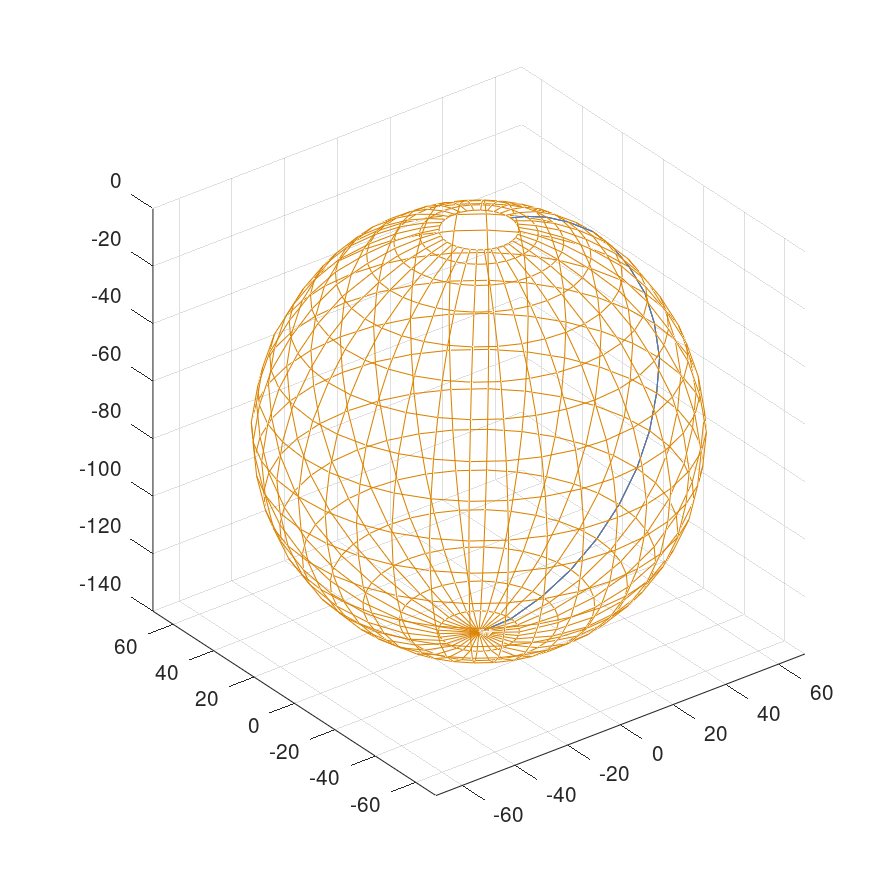
Plot lambertian LDC as wireframe:
ldc = readldt('lambert.ldt');
plot3dldc(ldc,'mode','wire')
See also: readldt
Result:
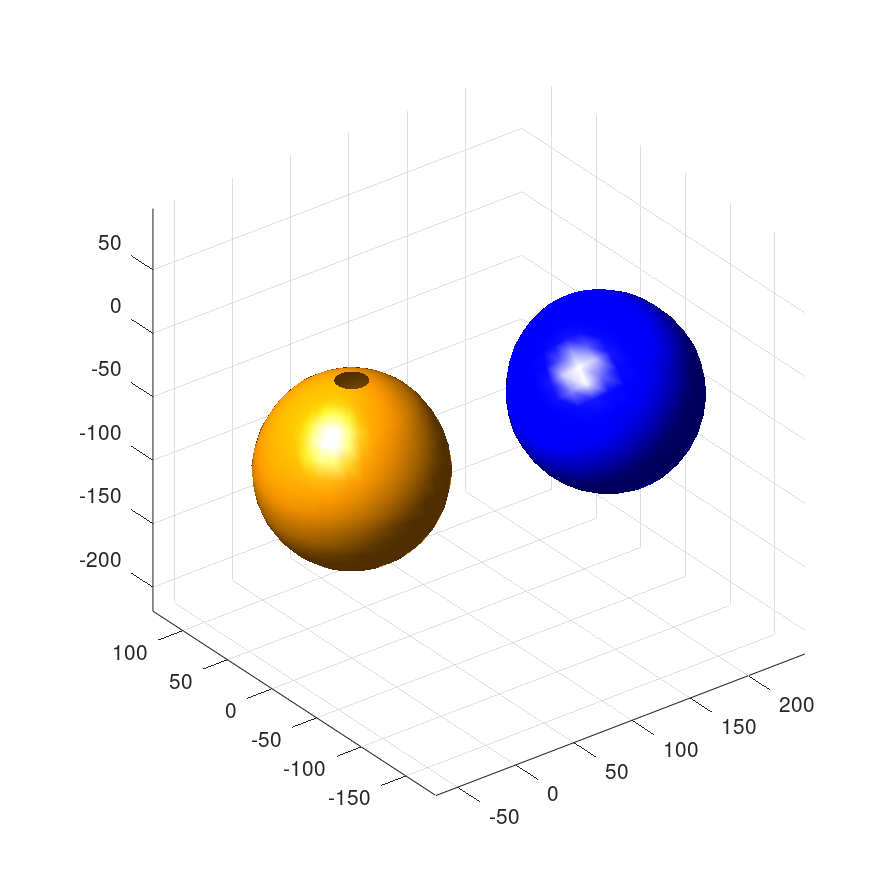
Plot two LDCs in one illutration using different colours and rotation:
ldc = readldt('lambert.ldt');
plot3dldc(ldc)
hold on
% create rotation matrix (x-axis, -45 degree)
R = rotMatrixD([1 0 0],-45);
plot3dldc(ldc,'clr',[0 0 1],'rotation',R,'origin',[180 0 0])
hold off
See also: readldt
Result:
References: