
The plotcfibar function plots the special colour fidelity indices which form the general colour fidelity index R_f. Any errors in the data set or in results generated with the Lighting Toolbox are not in the liability of the CIE nor me, see licence.
Usage:
plotcfibar(cri)
Where:
| Parameter | Description |
cfi | Is a single colour fidelity index (CFI) struct, see ciecfi function. |
Example
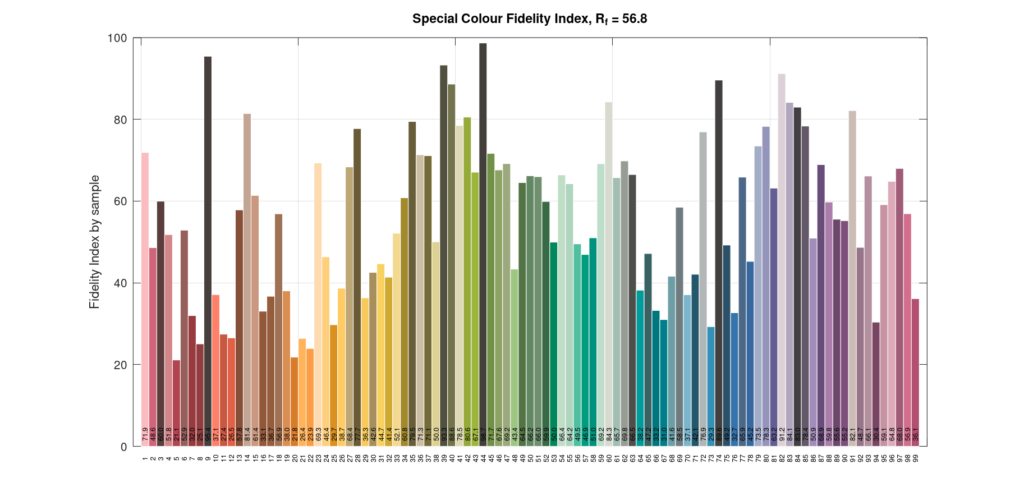
Plot special colour fidelity indices of standard illuminant ‘FL4’:
lam = 380:780;
spec = ciespec(lam,'FL4');
cfi = ciecfi(lam,spec);
plotcfibar(cfi)
Result:
Reference
CIE 2017 Colour Fidelity Index for accurate scientific use. Commission International de l’Éclairage (CIE), Vienna Austria, 2017, ISBN: 978-3-902842-61-9.